
三原色コンビニマップ / RGB & CMY convenience map
2019年8月
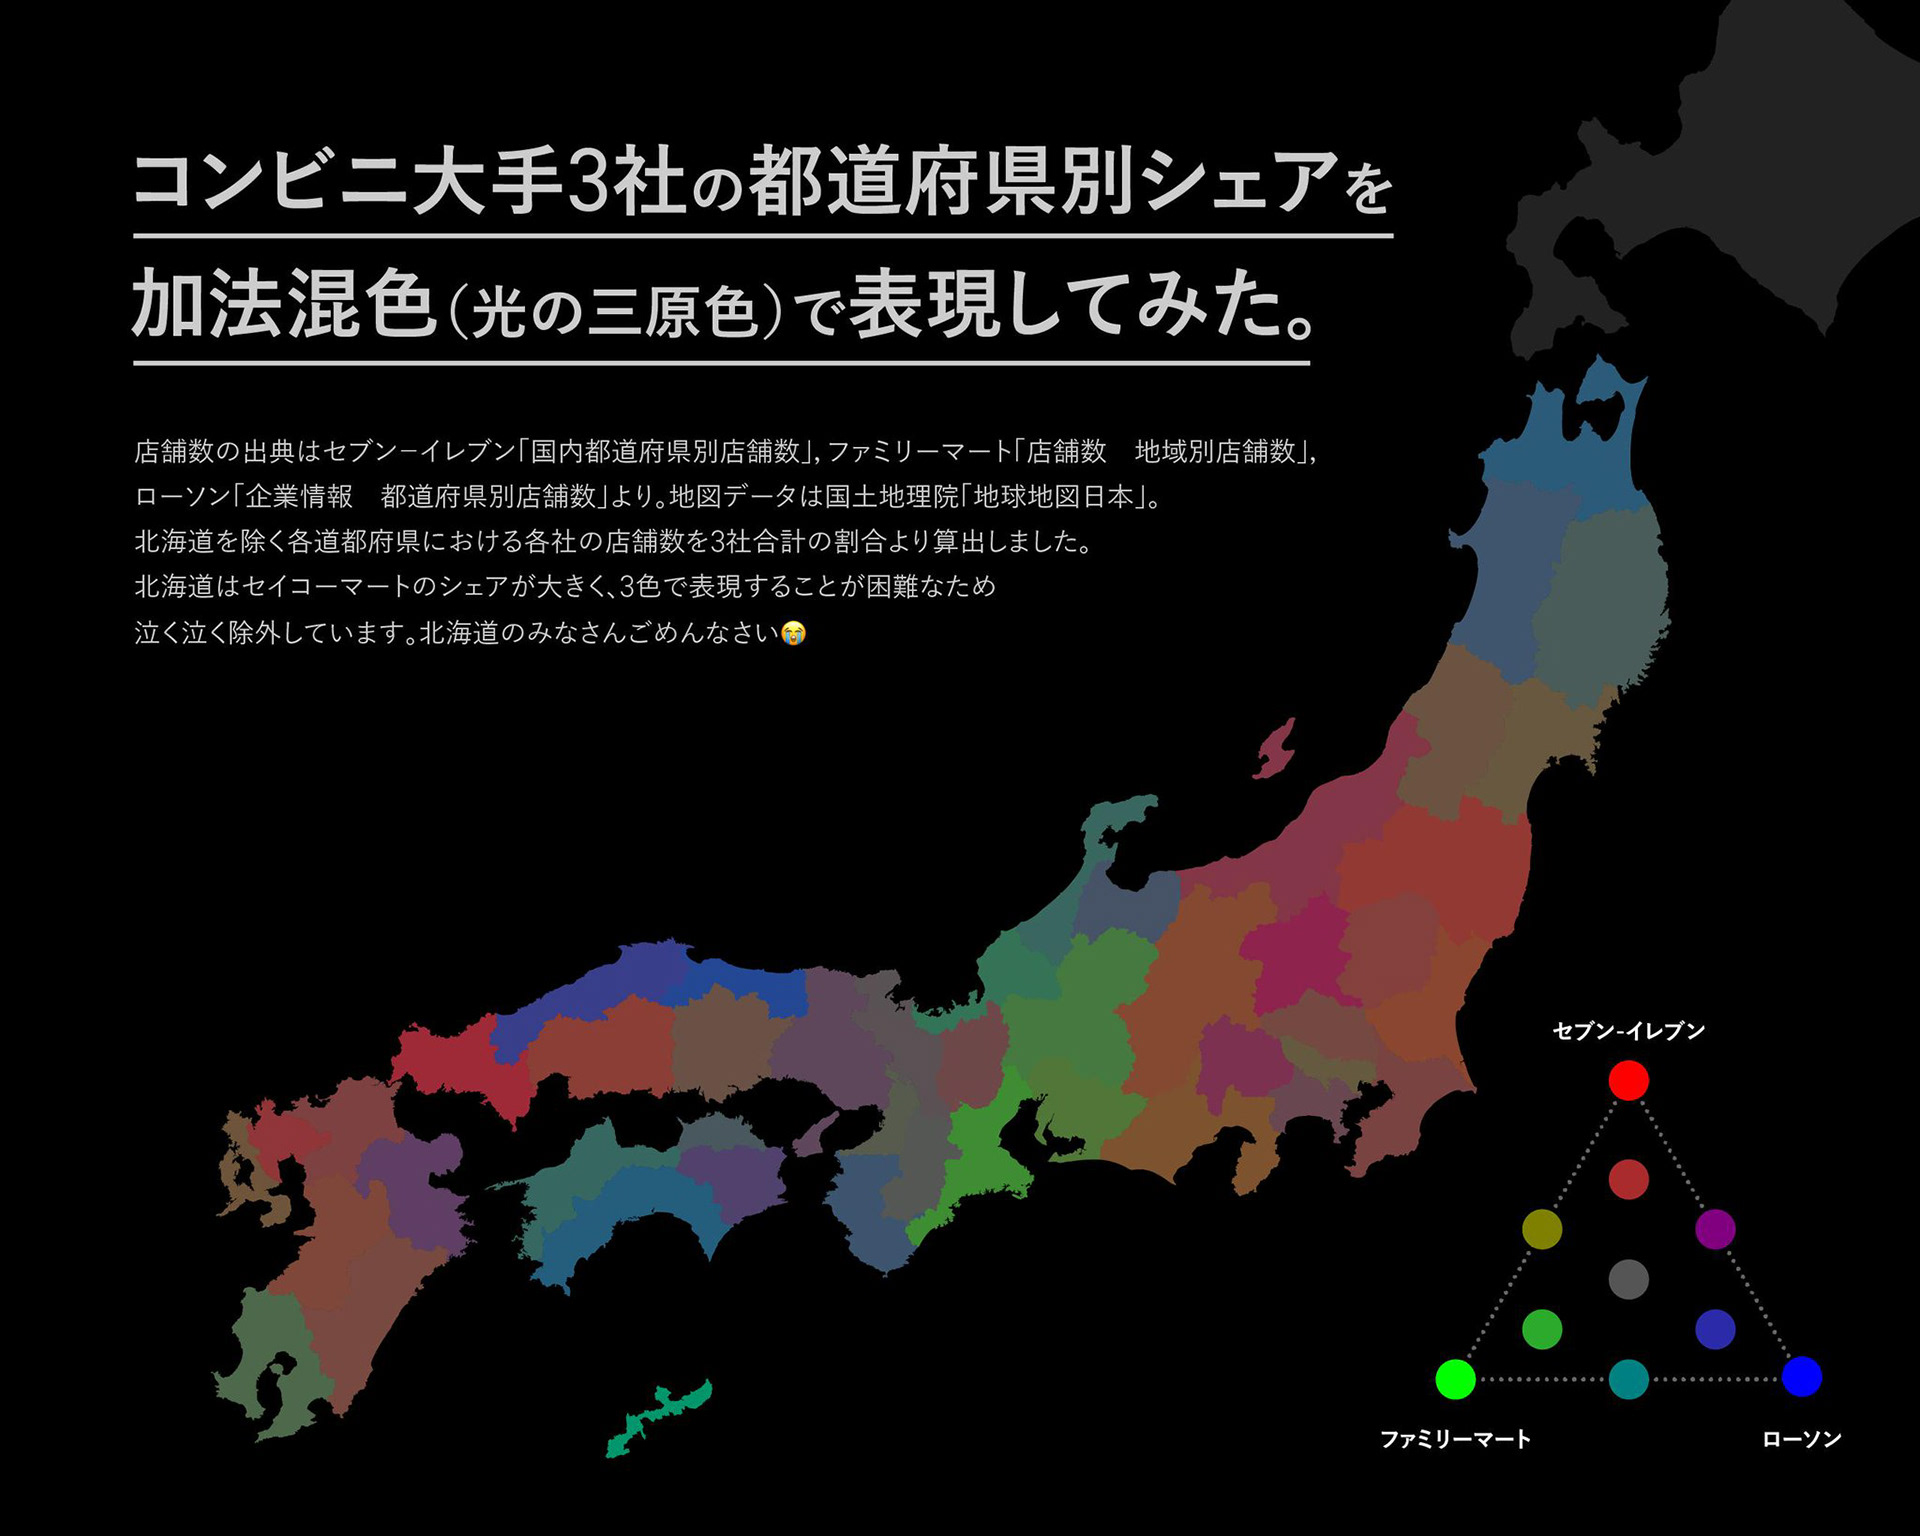
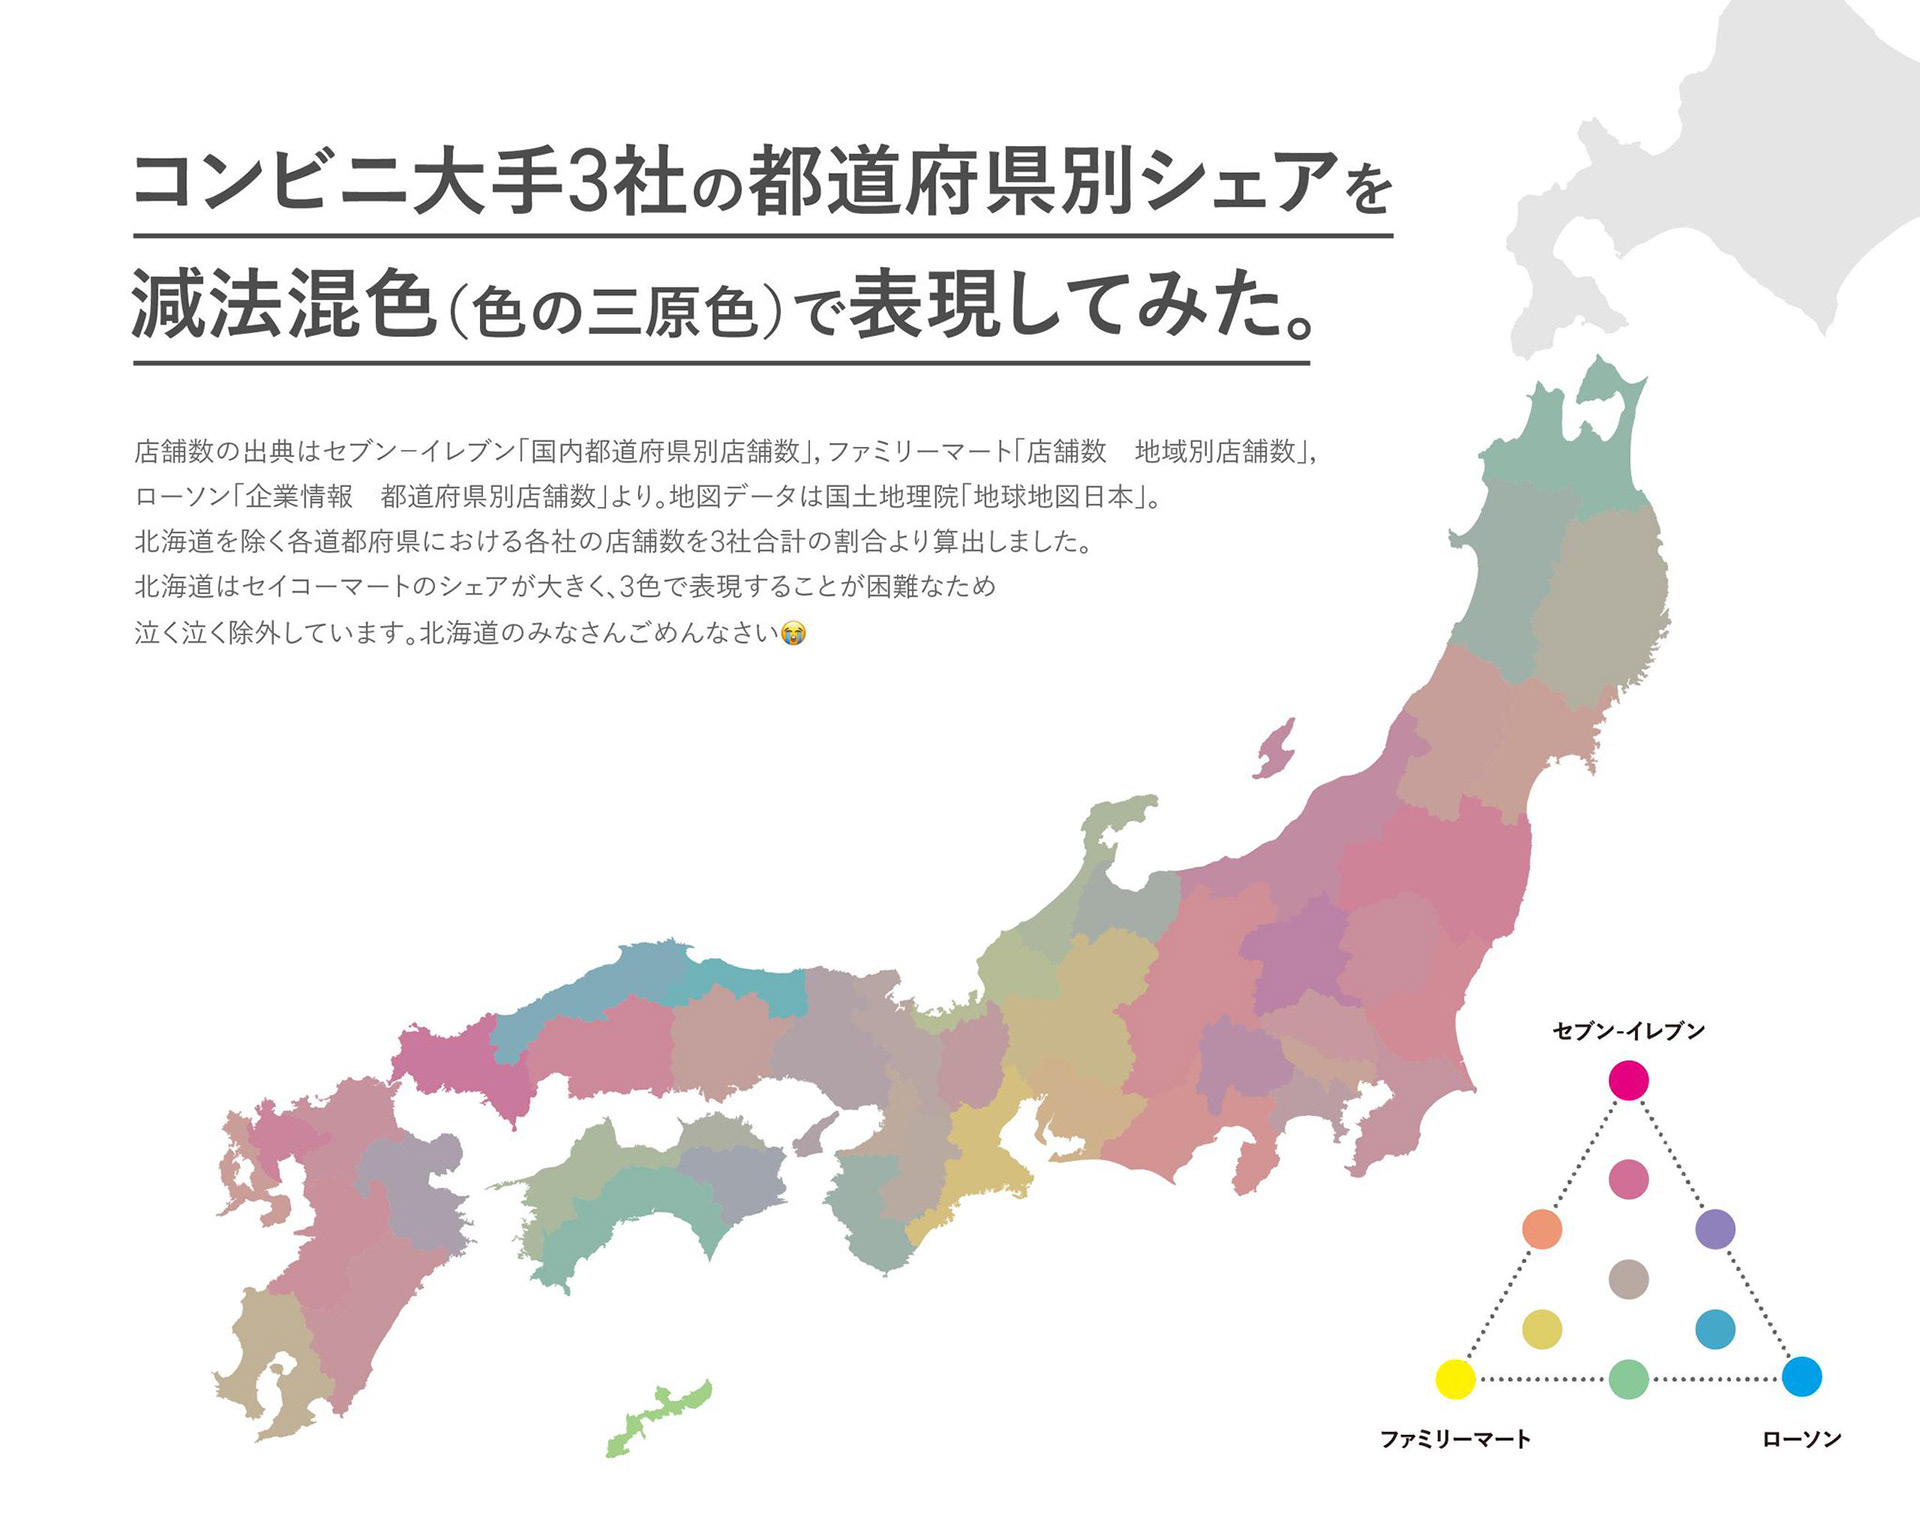
コンビニ大手3社の都道府県別シェアを、色の三原色(CMY/減法混色)と光の三原色(RGB/加法混色)で表現した作品。店舗数が最も多いチェーンで塗り分けた地図は昔からよく見るが、1店舗でも多ければ「1位」扱いになってしまい、拮抗しているかどうかが見えない。そこで各社のシェア比率をそのまま色の混合比率にすることで、1社が圧倒的に強い県はその社の色がはっきり出て、3社が拮抗する県は灰色に近づくようにした。例えば京都府はセブン35%・ローソン33%・ファミマ32%とほぼ均衡しており、灰色に近い色になっている。
A map visualizing the market share of Japan's three major convenience store chains by prefecture, using subtractive color mixing (CMY) and additive color mixing (RGB). Conventional maps simply color each prefecture by the chain with the most stores, but even a one-store lead makes a chain "number one," hiding how close the competition actually is. By mapping each chain's share directly to color mixing ratios, prefectures dominated by one chain show that chain's color clearly, while closely contested prefectures turn gray. For example, Kyoto Prefecture — with Seven-Eleven at 35%, Lawson at 33%, and FamilyMart at 32% — appears nearly gray.